Introduction
The composition and value of platinum group metals (PGM), such as Platinum (Pt), Palladium (Pd), and Rhodium (Rh), fluctuate greatly.
Using catalytic converters is more important than ever when purchasing, trading and recycling them. The total demand for platinum, palladium and rhodium in 2020 was 215 tons, 308 tons and 31.2 tons respectively.
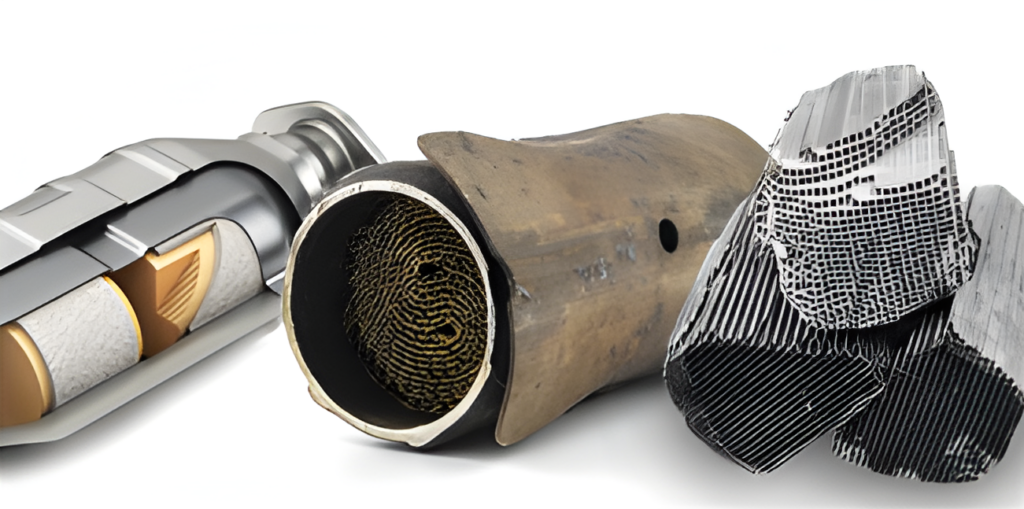
Approximately 32% of all Pt, 85% of all Pd, and 90% of all Rh are consumed by the Auto Catalyst Industry.
In the same year total of 33.7 tones of platinum, 41.2 tones of palladium and 7.3 tones of rhodium were recovered, mainly from scrap catalytic converter recycling activities; this is equal to the cumulative average price of refined metal worth of $12 billion USD.
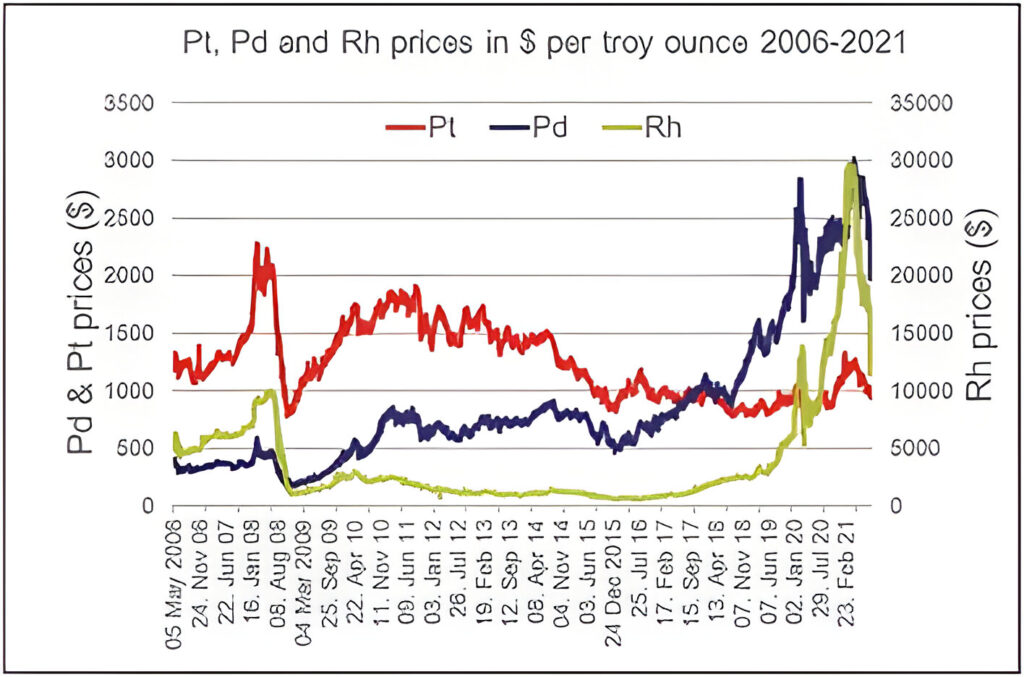
Platinum, palladium and rhodium prices have fluctuated negatively over the last 15 years depending on supply, demand and expectations (see Fig. 1).
The variations and the tightening of emission rules and regulation directly affected the compositions of the catalysts, which were a key ingredient on the demand. Due to the supply chain being affected, Pd, and Rh prices sky rocketed during 2020-2021.
The cost of the PGM component of a catalytic converter can range from $100 to $1000. When commercially traded, this material is usually grounded into a powder or a mixture;
Therefore, traders and recyclers or dealer’s must be capable to do the following:
- Identify individual catalytic converters or components containing high levels of platinum group metals
- Pay or receive a fair price
- Catch counterfeit mixtures and contamination of mixtures.
It is very important to calculate the contents of Pt, Pd, and Rh of scrap automotive catalytic converters perfectly to determine the exact value and stay away from major financial losses or blunders.
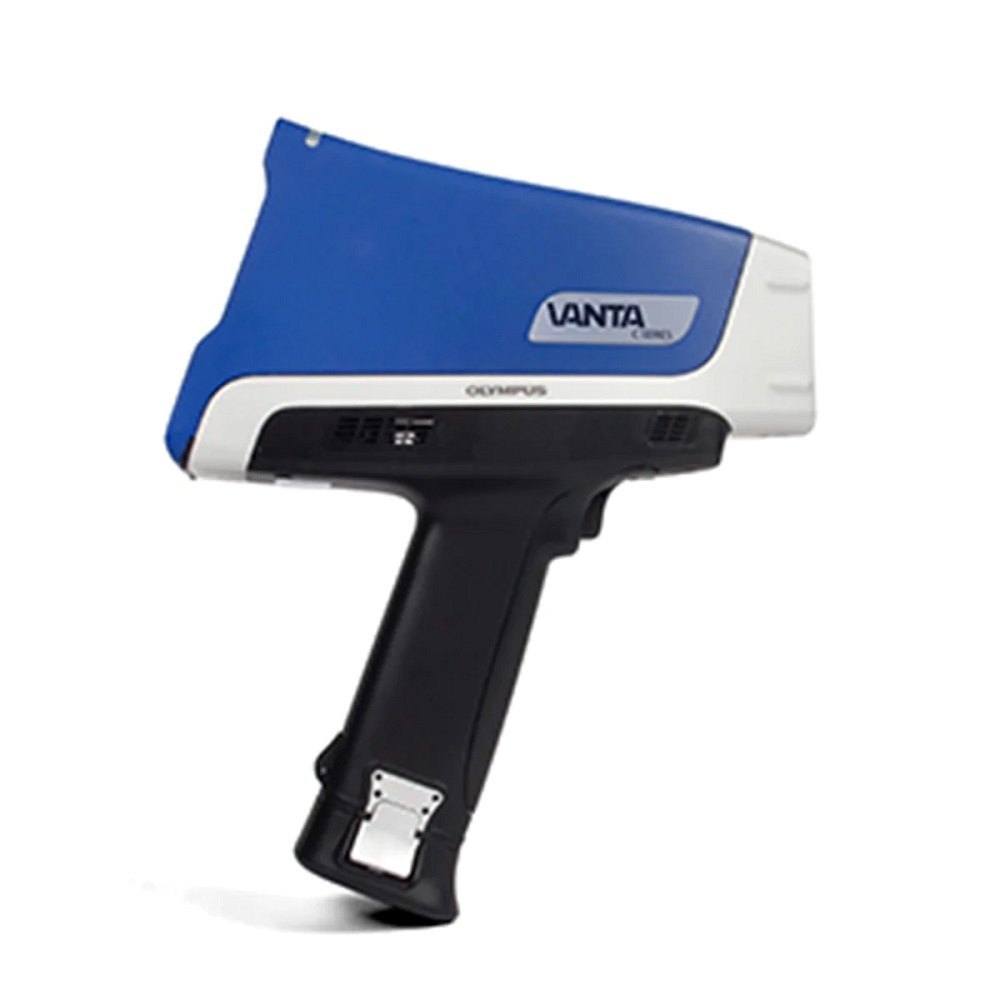
We offer a complete range of mobile XRF instruments to accurately measure Pt, Pd and Rh in automotive catalytic converters:
Pre-calibrated auto catalyst modes using the Method of Fundamental Parameters (FP), a method that uses theoretical constants to adjust for effects type. Of all functions in the models, FP is essential for the analysis of today’s waste materials, which show unprecedented variation in their composition. Measuring the potential for high levels of rare earth elements such as zirconium, lead and others in catalysts is an important point in obtaining accurate results for Pt, Pd and Rh.
Sample Preparation
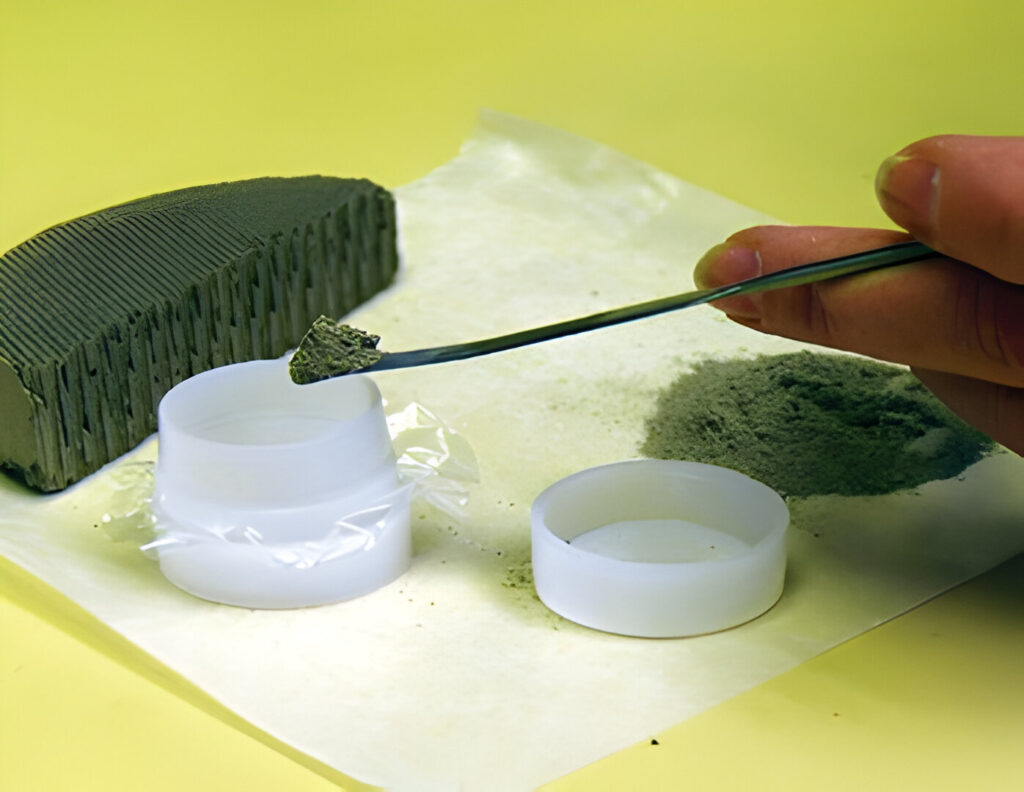
The ceramic matrix catalyst is subjected to tank removal, i.e. the honeycomb ceramic is removed from the metal shell. Auto catalyst materials are made of ceramic substrates, usually cordierite coated with a platinum group robot-containing layer.
Therefore, all ceramics are separated, crushed, ground and often mixed with other catalysts. In contrast, converters with metal substrates are first crushed or ground; Magnets and winnowing are used to separate metal parts from repair powder containing precious metals. Because of this abundance, the PGM content in metallic catalytic converter coatings is generally higher than in ceramic converters. In both cases, the material is crushed to a particle size, usually less than 250 µm, loaded into the XRF container for analysis and placed on the test bench.
Results
Table 1 presents the results of the analysis of the vending equipment used. Pt, Pd and Rh values measured using the Handheld XRF analyzer were in good agreement with the validated results.

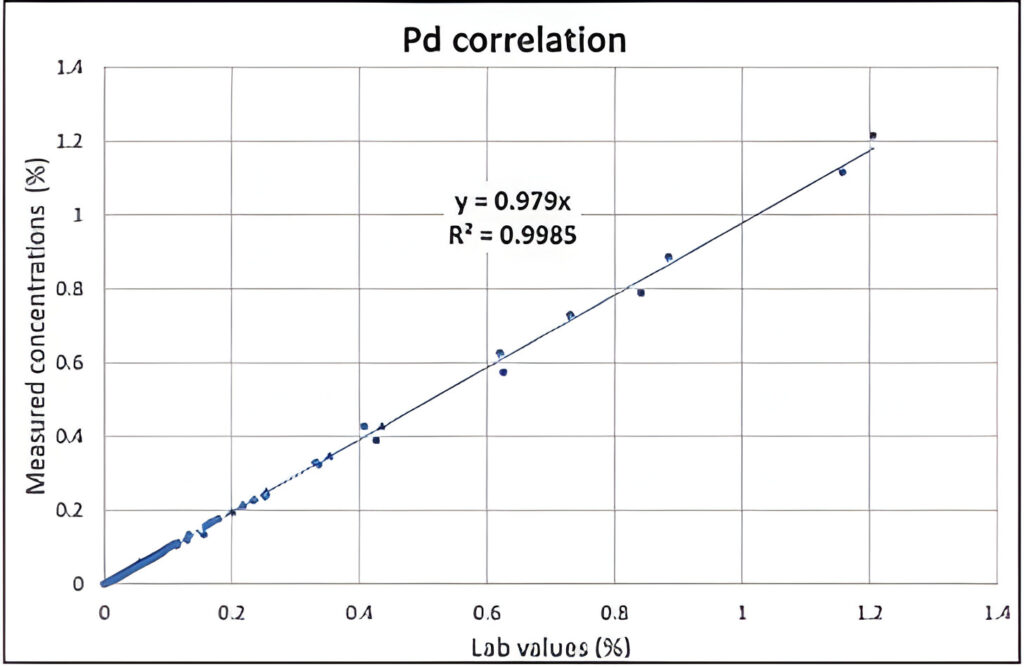
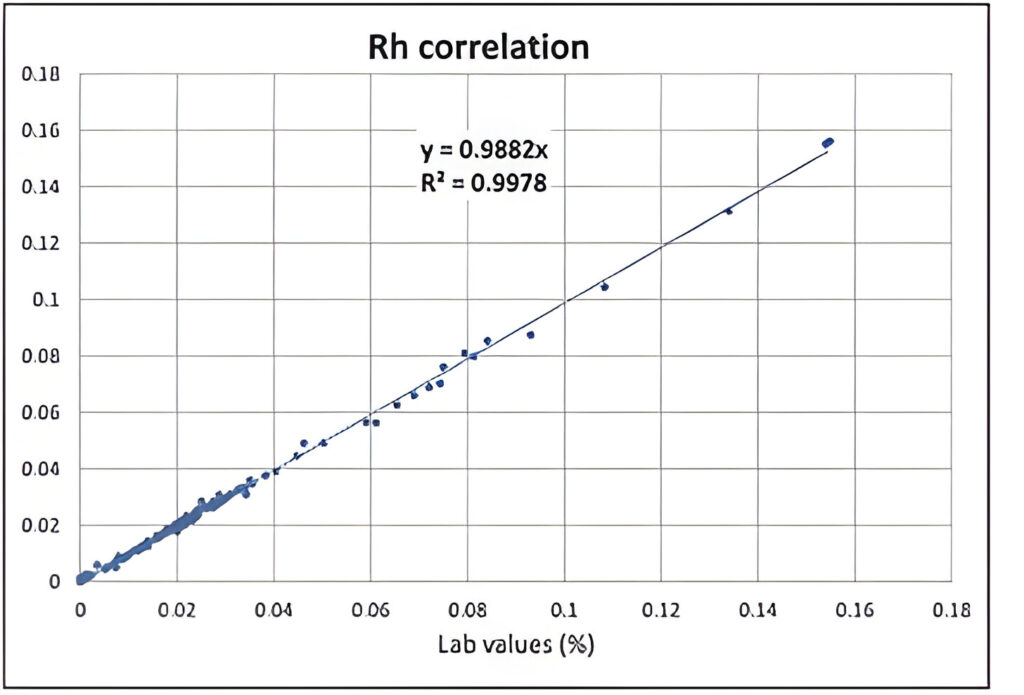
Figures 2 to 4 & table 1 show the relationship between test results (fire test + ICP) and test results. Concentration was measured using a Handheld XRF analyzer. For all points determined on the 120 samples, there is a good relationship between the line between the test and the width measurement: both the slope and the coefficient of determination R2 are close to 1. The average relative difference between laboratory and laboratory measured values is 5.0% for Pt, 3.9% for Pd and 2.9% for Rh. These results demonstrate the power of the analysis for transformation of the matrix, with many combinations sometimes found in the 120 samples with elements such as cerium, lanthanum, zirconium, lead, iron or chromium.
Table 1: Results of analysis for a available automotive catalytic certified material
| Materials/Elements | Handheld XRF value (ppm) | Certified value (ppm) |
| BAM ERM-504a | ||
| Pt | 1495 ± 41 (2σ) | 1414 ± 15 |
| Pd | 1583 ± 19 (2σ) | 1596 ± 6 |
| Rh | 210 ± 8 (2σ) | 210 ± 4 |
Proficiency testing
As a laboratory, we are involved in the well-known testing of the well-known company XRF Fluxana and examine two samples FLX-CRM FLX-CRM 133. , Lab code #9. The results shown in Table 2 and the report published by
Fluxana once again demonstrate the accuracy of the analysis using the Handheld XRF analyzer .

Heya i’m for the first time here. I found this board and I find
It truly useful & it helped me out much. I hope to give something back and help others like
you helped me.
Magnificent beat ! I wish to apprentice while you amend your site, how can i
subscribe for a blog site? The account helped me
a acceptable deal. I had been tiny bit acquainted of this your broadcast provided bright clear concept
I am genuinely glad to glance at this blog posts which carries tons of useful
information, thanks for providing such data.